
- Protocol
- OPC UA
- Database
- PostgreSQL 18 + TimescaleDB
- Server
- ASP.NET Core 10.0
- AI engine
- Ollama, local
- Authentication
- Local or Entra ID
- Languages
- Finnish, English, Swedish, German
What is DataPortia?
DataPortia is an application installed on a Windows or Linux server. It reads measurement points from automation systems using the OPC UA protocol, stores the values as a time series and provides a browser interface to them. On one platform it replaces hand-built Excel reports, separate monitoring tools and cloud-based analytics services.
PostgreSQL and TimescaleDB come with the installation package, so no separate database installation is needed. In most environments the software is running in under 30 minutes.
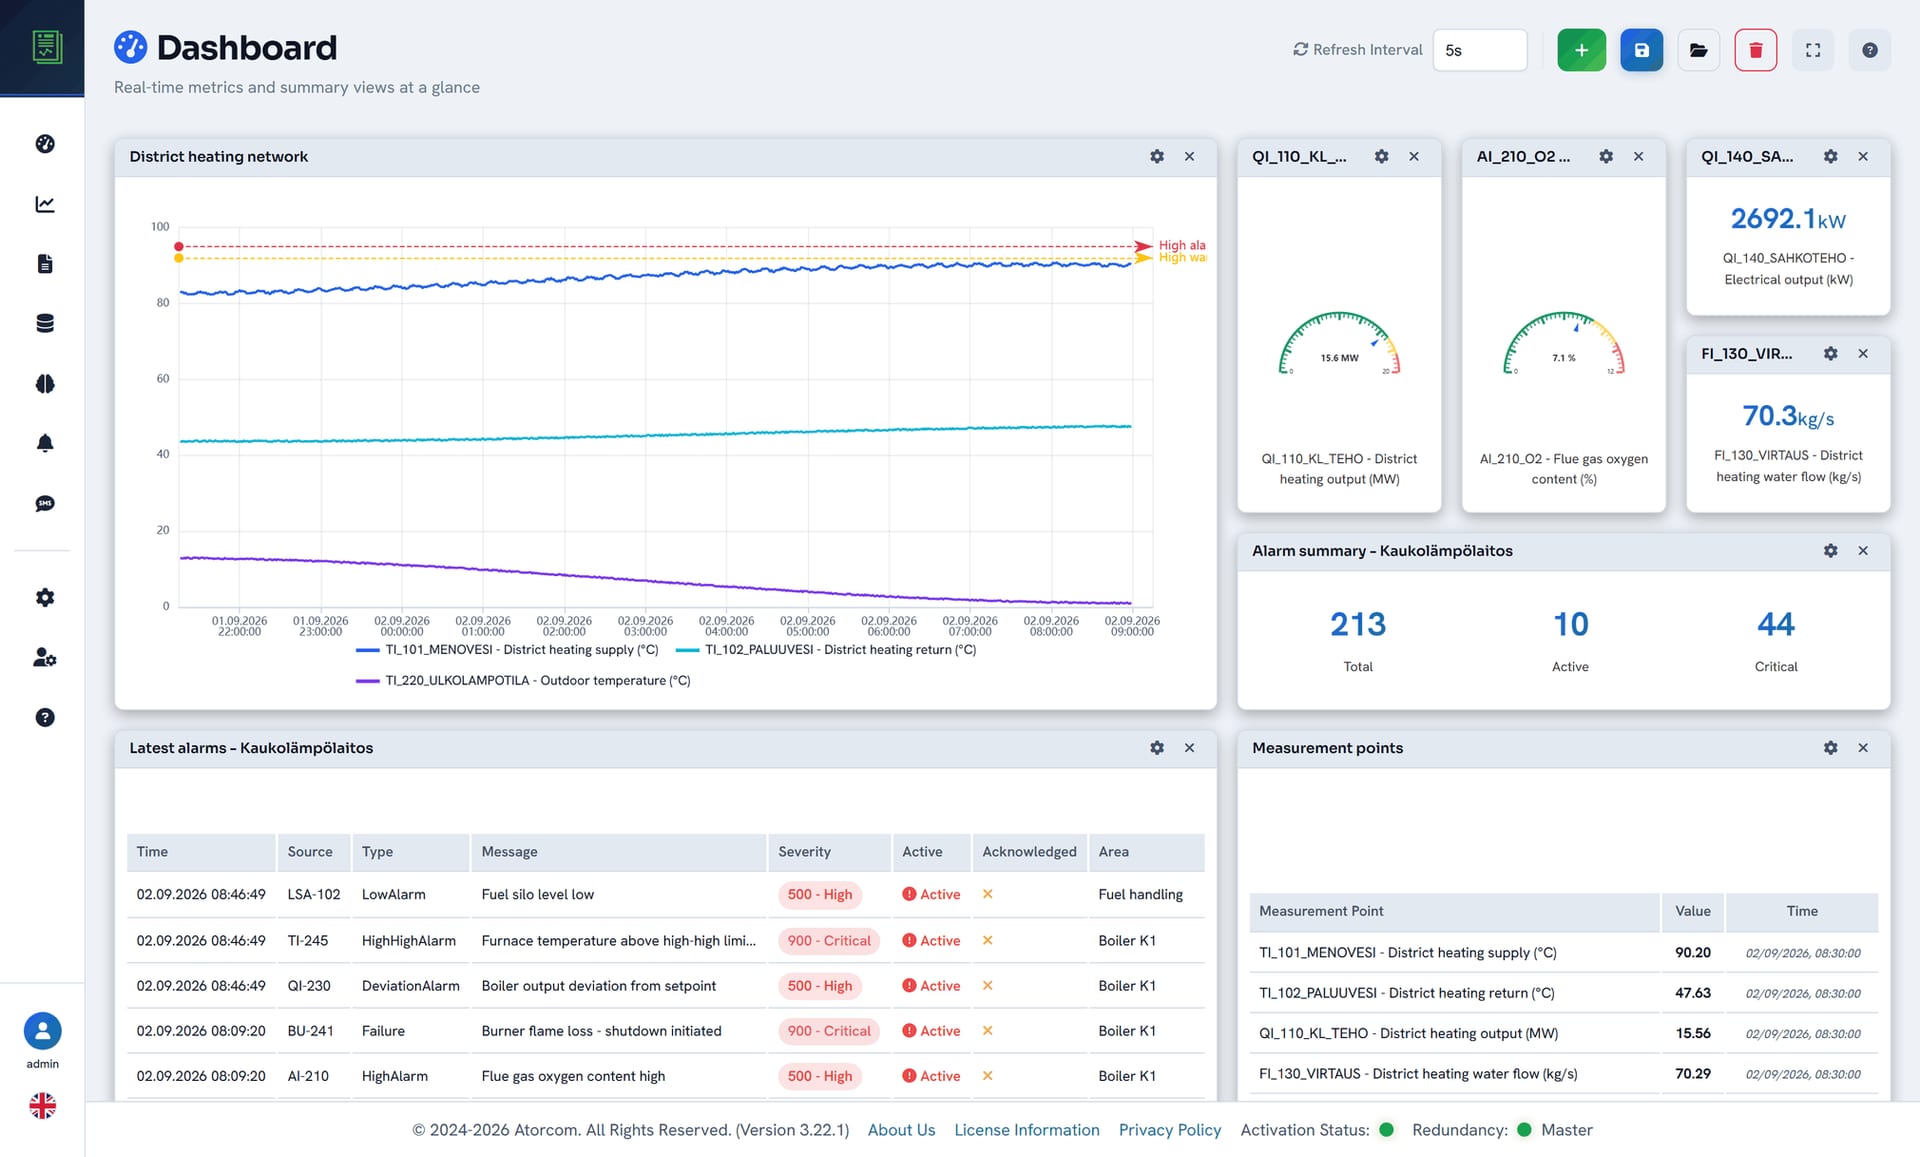
Technical summary
| Protocol | OPC UA (OPC Foundation .NET Standard) — Data Access and Alarms & Conditions |
|---|---|
| Database | PostgreSQL 18 + TimescaleDB, optimised for time series |
| Server | ASP.NET Core 10.0, its own Kestrel server |
| Interface | Vue 3 browser application, ECharts, DataTables |
| AI engine | Ollama, a local language model — no internet connection |
| Authentication | Local, or Azure AD / Microsoft Entra ID |
| Operating systems | Windows 10/11, Windows Server 2016+, Linux (Debian, Ubuntu) |
| Interface languages | Finnish, English, Swedish, German |
| Throughput | 2 000+ values per second, 172 million rows per day |
| Compression | Automatic after 2 days, over 90 % disk space saved |
| Retention | Adjustable, 24 months by default |
| Minimum requirements | 8 GB RAM (16–32 GB recommended), 100 GB SSD |
Functional areas
DataPortia functionality falls into seven areas. Each has its own page, where the subject is covered in full.
01
OPC UA data acquisition
Several parallel connections, measurement point browsing, subscriptions and redundant server pairs.
02
Alarms and events
OPC UA Alarms & Conditions, the original millisecond timestamp, sequence-of-events analysis and Pareto.
03
Automated reports
PDF, CSV and Excel on a schedule. Your own report templates with a logo, cover page and signatures.
04
Dashboards and trends
Freely positioned widgets and zoomable historical trends with presets.
05
Local AI analysis
Anomaly detection, forecasts and cost optimisation with a local language model.
06
REST API and webhooks
A read-only interface to measurement points, historical data and alarms. HMAC-signed webhooks for MES, ERP and BI integrations.
07
Redundancy and high availability
Redundant server pairs, PostgreSQL replication and the DPFC fault-tolerance controller, which automates failover on Windows as well.
Measured
2 000+
values per second · 172 M rows per day · over 90 % compression
Which automation systems does DataPortia support?
DataPortia supports every system that conforms to the OPC UA standard. In practice that means Siemens, ABB, Valmet, Beckhoff, Schneider Electric, Honeywell and Rockwell Automation, among others — and any other system with an OPC UA server.
The connection is not tied to an equipment supplier, and commissioning requires no changes to the automation system. DataPortia acts as an OPC UA client that reads from the server.







- StandardOPC UA
Pricing
What does DataPortia cost?
Licensing is based on the number of simultaneous OPC UA connections. The licence is a perpetual one-off payment, with seven tiers from a single connection up to unlimited.
The price scales with the number of connections. Ask for the price list and we will tell you which tier matches your environment. Reseller: PCS-Engineering Oy.
SMS alarms are still under development, and the feature has not yet been tested in a production environment. It is therefore not yet available. Mention it when you get in touch if the feature matters to you, and we will tell you where it stands.
- Perpetual licence, one-off paymentSeven tiers by number of connections
- from 4 000 €
- AI analysis moduleAdd-on
- 499 €
- High availability (HA)Add-on
- 1 000 €
- SMS alarmsAdd-on — not yet available
- In development
How does the trial start?
The trial runs for 30 days and includes every feature except the HA add-on. Describe your environment briefly on the form — the automation system and an estimate of the number of connections are enough — and we will deliver the installation package and a trial licence.
DataPortia on review sites
Independent listings where DataPortia can be reviewed and other reviews read.