- 1 ms
- precision The server's original timestamp
- 0
- changes to automation Subscription to the existing OPC UA server
- 3
- analyses Pareto, duration and severity
What tripped first?
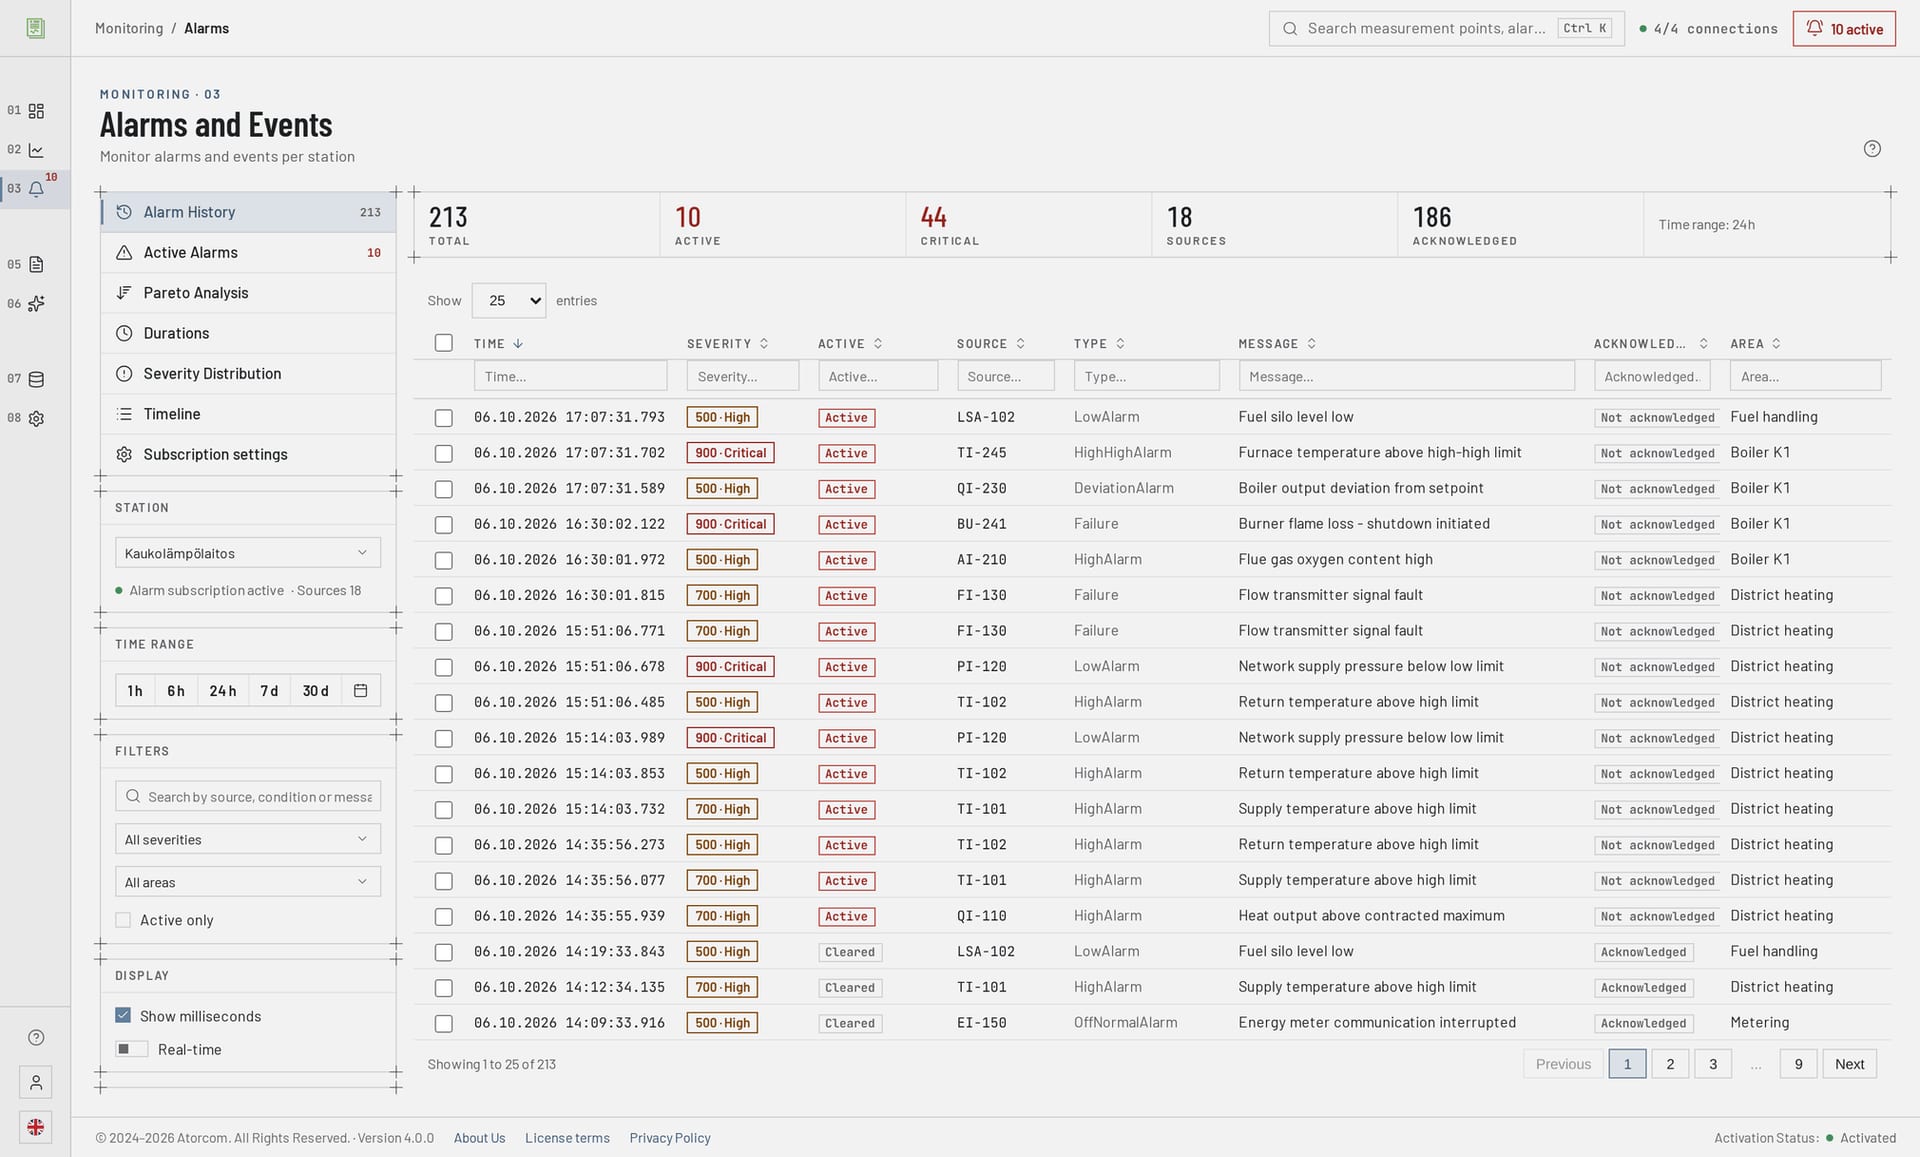
Sequence-of-events (SOE) analysis orders the alarms by their original timestamp to millisecond precision. When ten alarms arrive within the same second, the view tells you which of them was first and which followed it. The order is based on the automation server's timestamp, not on the moment DataPortia received the event.
In detail: how a burst is unpacked in the view
The situation is a familiar one: a line stops, and a couple of dozen rows appear on the alarm list within a second. Some of them are the cause, the rest are the consequence. In sequence-of-events analysis the same burst opens up millisecond by millisecond, and the first event in the chain stands out from the rest. Narrow the time window to the stoppage and the area to the part of the process where the chain started. The same view also answers the question raised afterwards: did the interlock come on before the pump stopped or after it.
Why does the original timestamp decide root cause analysis?
A root cause can be told apart from its consequences only by the order of events. If the timestamp is rounded to seconds, ten alarms that tripped within the same second lose their order relative to each other, and the first one can no longer be pointed out. DataPortia stores the timestamp the automation server gives exactly as it is: it is not rounded, and it is not replaced with the moment the event was written to the database.
In detail: what has to be verified at deployment
At deployment it is worth verifying one thing: that the automation server publishes a source timestamp for events and not merely its own receive time. DataPortia stores what the server gives — and that decides how precise an analysis can be made from the alarm history afterwards.
| Stored timestamp | What it can tell you |
|---|---|
| Automation server timestamp, millisecond precision | The order of events relative to each other, even within the same second. This is what DataPortia stores. |
| Timestamp rounded to the second | Only which events fell within the same second. The order inside the burst is lost for good. |
| Time of writing to the database | The order in which the events made it through. Network and queue latency is mixed in. |
How are alarms read from the automation system?
DataPortia subscribes to events from the OPC UA Alarms & Conditions interface (Part 9), which is the standard's own alarm model. The subscription is made to the existing OPC UA server, so no changes have to be made to the automation system. Acquisition works with every OPC UA compatible system: Siemens, ABB, Valmet, Beckhoff, Schneider Electric, Honeywell and Rockwell.
In detail: interface, subscription, timestamp and storage
- Interface
- OPC UA Alarms & Conditions (Part 9), on top of the OPC Foundation .NET Standard stack.
- Subscription
- Events are received as a subscription: an alarm is recorded as the server publishes it.
- Timestamp
- The original timestamp given by the server is stored untruncated, to millisecond precision.
- Storage
- PostgreSQL 18 + TimescaleDB, the same time-series database as the measurement data.
The prerequisite is that the automation server publishes events according to the Alarms & Conditions model. If the server's alarm model is a limited one, DataPortia shows what the server gives — no more. Establishing connections, browsing measurement points and redundant server pairs are covered on the OPC UA data acquisition page.
How do I find the right alarm among thousands?
The view has a free-text search field that looks in the source, the message and the condition name at the same time. Alongside it every column has a search field of its own, and the top of the view has filtering by severity, area and time range. With the column search you find a point by device tag or by the wording of the alarm, and the filters work together: the high-severity events of one area from last night can be brought up without scrolling the list by hand.
In detail: search order and the link to the trend views
In practice the search goes from coarse to fine: first the time range around the stoppage, then the area and the severity, and finally the column search by device tag. Because the alarms and the measurement data sit in the same time-series database, the same time window can also be viewed as trend curves — the trend views are described on the Dashboards and trends page.
Which alarms recur the most?
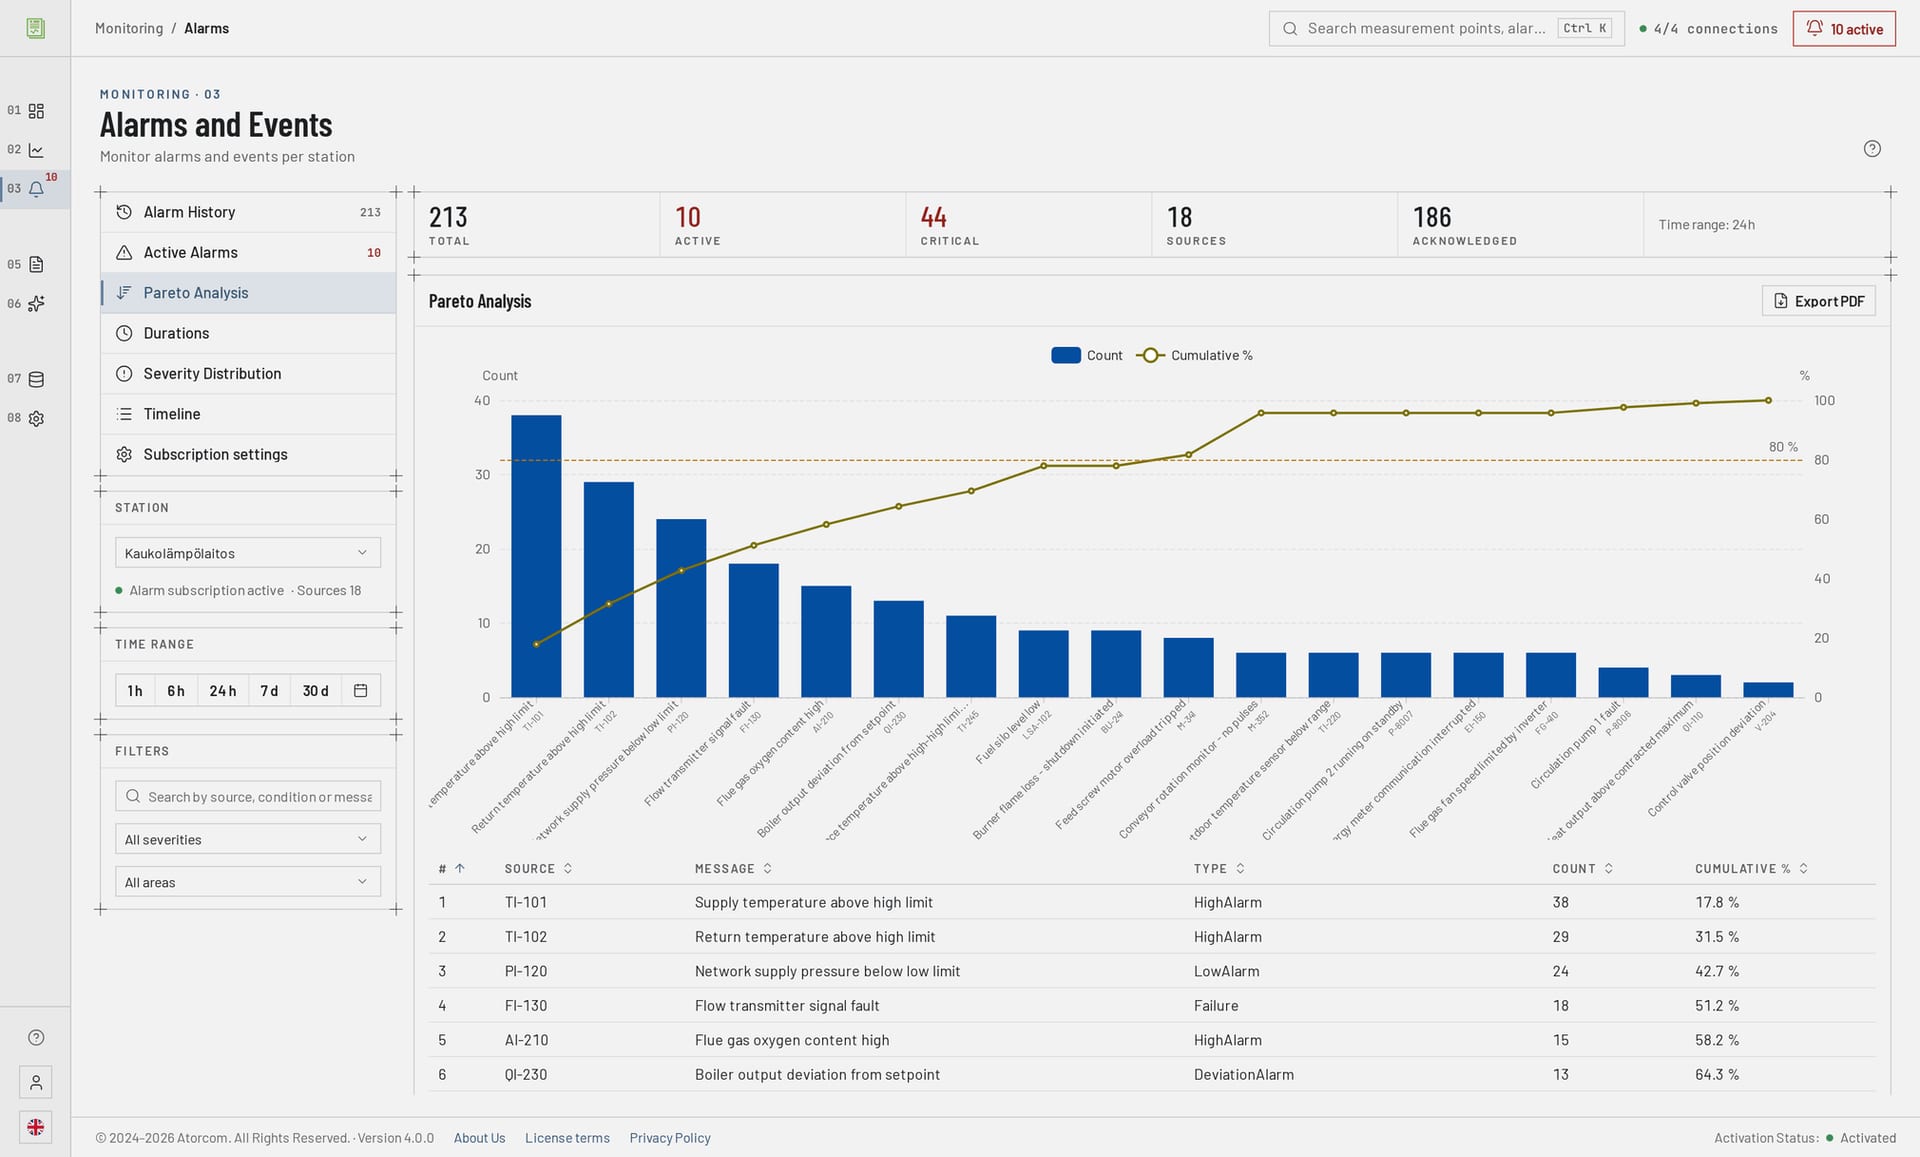
Pareto analysis calculates, over the selected time range, which alarms recur most often, and orders them by count. Duration analysis tells you which alarms stay on the longest, and severity analysis shows how the events are distributed across severity classes. Together they point out which few points produce most of the alarm load. All three are calculated from the same event history.
In detail: what the three analyses tell you
Pareto
Which ones recur
Alarms ordered by count. At the top stand out the few points that fill the list day after day.
Duration
Which ones stay on
Alarms by duration. An alarm that trips rarely but stays on for a long time does not stand out from counts alone.
Severity
How the load is distributed
The distribution of events across severity classes. It tells you how much of the list is genuinely critical and how much is background noise.
The top of the list is usually short: a few points produce a large part of the row count. Those are worth going through first — a setpoint, a delay or a chattering contact — before wider conclusions are drawn from the alarm history.
How is alarm history exported as a report?
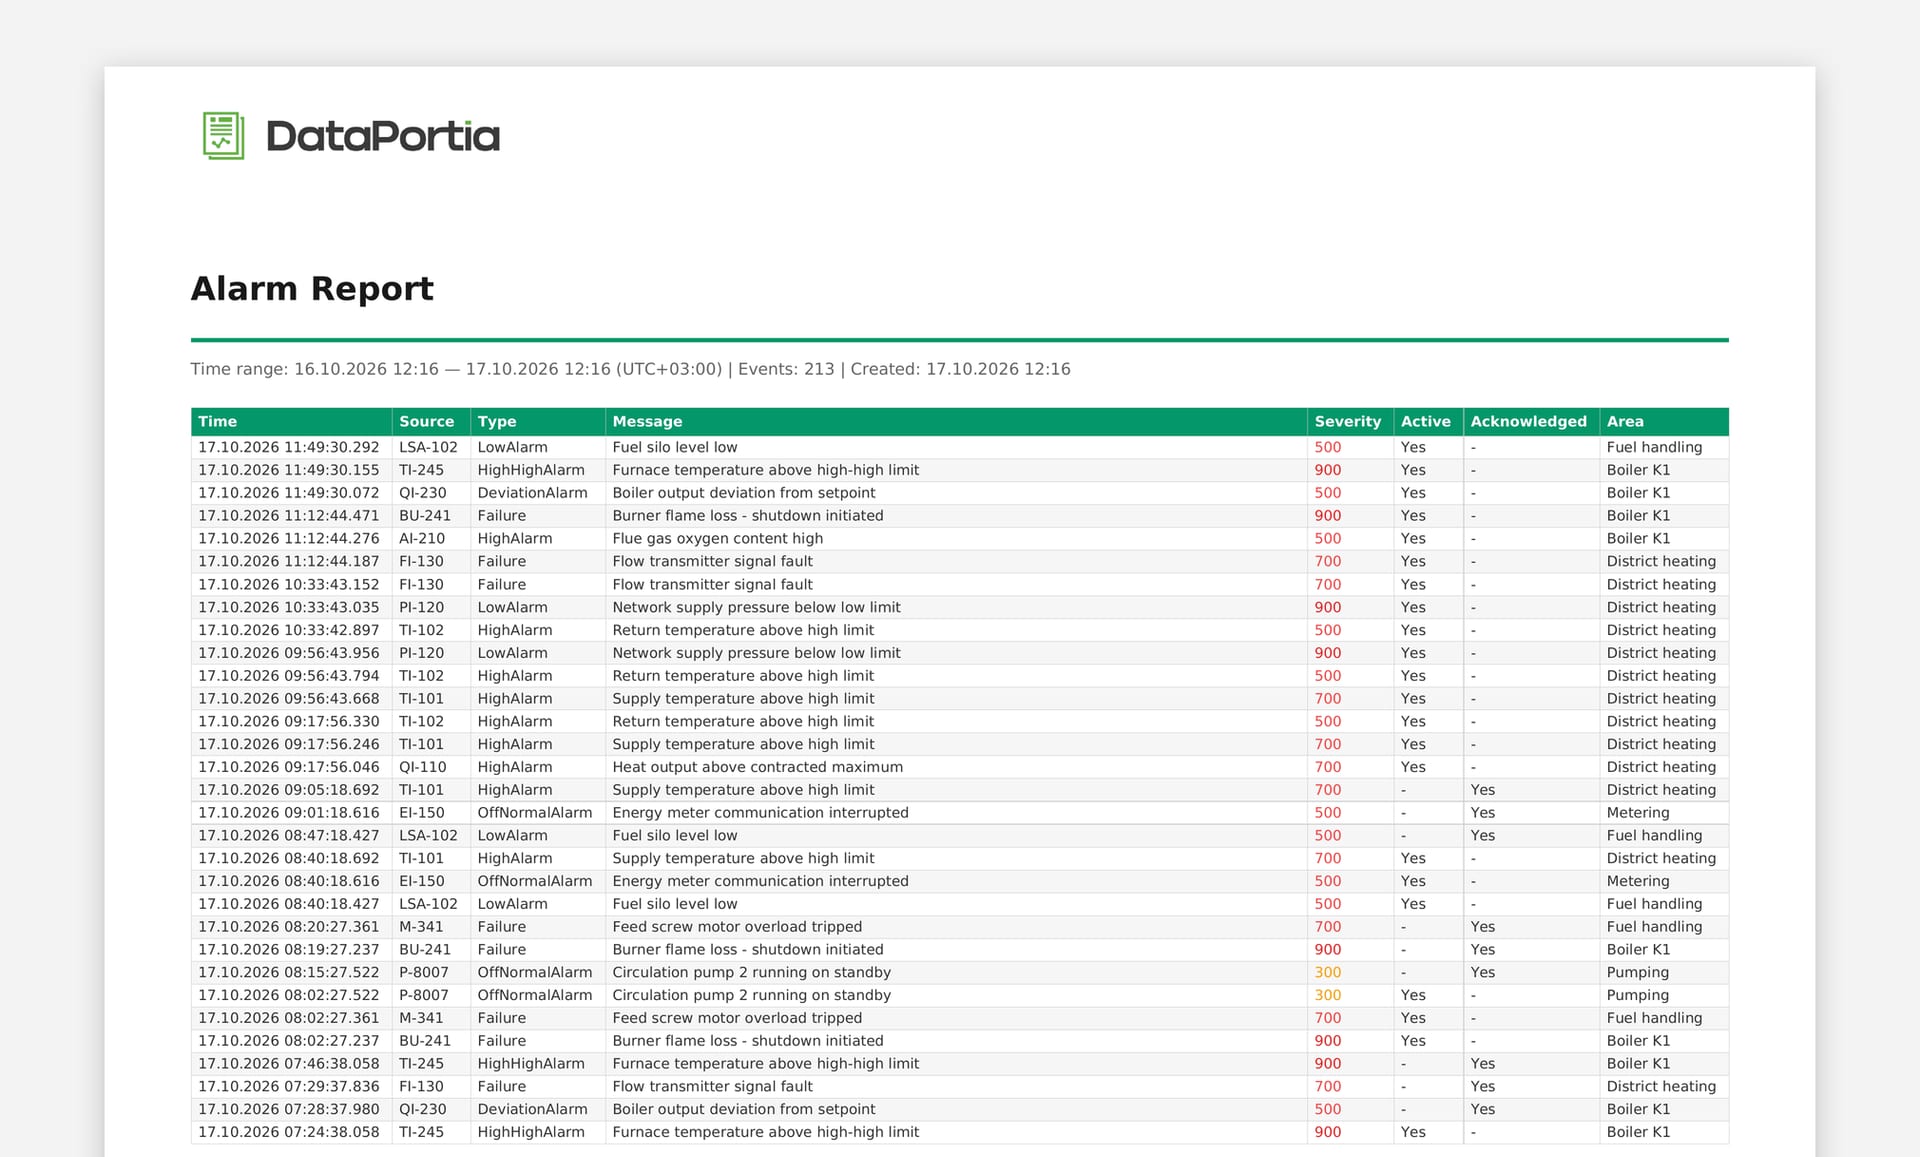
The alarm view can be exported in CSV, Excel and PDF format. With milliseconds switched on in the view, the original timestamp is kept in the export to millisecond precision, so the order of events is not lost on the way to a deviation report or to a statement sent to a customer. The PDF report can also include the charts and tables of the alarm analyses: Pareto, durations, severity distribution and timeline. The follow-up investigation of a stoppage is finished in the same view in which it was done: narrow the time window, check the order and export the file without a separate tool.
In detail: report templates, schedules and other export formats
Report templates, schedules and other export formats are described on the Automated reports page.
Can I get a text message when an alarm trips?
No. SMS alerts are In development and the feature has not been possible to test, so it is not available and we do not sell it as a finished feature. At present alarms are shown in the browser user interface and in the reports compiled from it. If a notification is a requirement in your environment, say so when you get in touch — we will tell you where the development stands and will not promise a schedule.
In development SMS alerts. The feature has not been possible to test and it is not available. Everything else described on this page is in use.
What is alarm analysis not enough for?
DataPortia keeps the precision the automation server gives — it does not improve on it. If the source system stamps events at second precision, no tool will bring the order out afterwards. If alarms are read from several servers, the clocks of those servers have to be synchronised, or the order between servers is not reliable.
In detail: who draws the conclusion from the data
The analysis gives the order, the counts and the durations. The conclusion is still drawn by a person who knows the process. For going through the material there is also a separate AI module that runs a local language model on the same server: Local AI analysis.
Frequently asked questions
These questions come up in almost every deployment: what is required of the automation system, whether the milliseconds survive the export, whether acquisition works in a redundant environment, which systems are supported and where SMS alerts stand.
Do changes have to be made to the automation system?
No. DataPortia is an OPC UA client that subscribes to events from the existing server. The prerequisite is that the server publishes alarms according to the Alarms & Conditions model.
Do the milliseconds show in the export as well?
Yes. The original timestamp is kept to millisecond precision both on screen and in all three export formats.
Does alarm acquisition work in a redundant environment?
Yes. OPC UA connections can be configured as redundant server pairs. DataPortia's active–passive failover takes about 15–30 seconds, and it concerns the application level only. Details: Redundancy and high availability.
Can an alarm be forwarded as a text message?
Not for now. SMS alerts are In development, and the feature has not been possible to test. It is therefore not available.
Which automation systems are supported?
All OPC UA compatible ones: Siemens, ABB, Valmet, Beckhoff, Schneider Electric, Honeywell and Rockwell among others.
The trial is 30 days and includes every feature except the HA add-on, with no commitment. When you get in touch, tell us the automation system and the estimated number of OPC UA connections — we will deliver the installation package and a trial licence. The other areas: DataPortia.
How do I test this on my own alarm data?
The trial period lasts 30 days, includes every feature apart from the HA add-on and commits you to nothing. Alarms are read straight from your own automation system’s Alarms & Conditions interface onto the plant’s own server — that is when you see whether the true first event stands out from your own alarm burst. Licences start at a 4 000 € perpetual licence, and the price scales with the number of OPC UA connections.